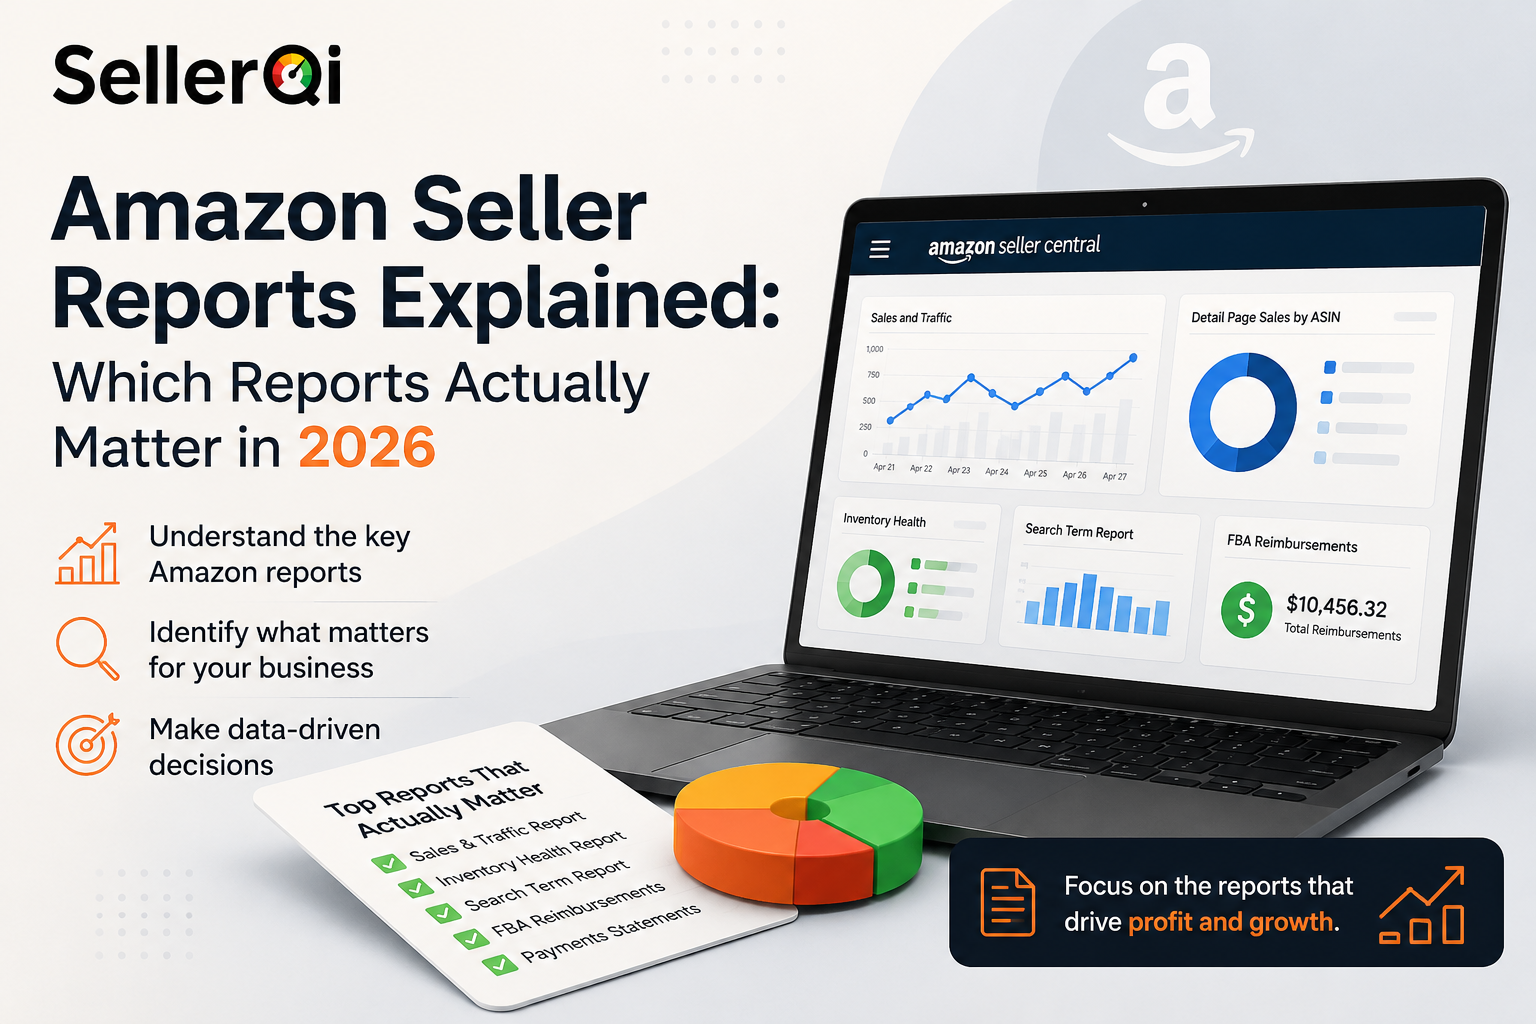
Amazon Seller Central has over 40 report types, but most sellers only need 8 to 10 regularly. The ones that actually drive decisions are the Sales and Traffic Report, Detail Page Sales by ASIN, Inventory Health Report, Search Term Report, FBA Reimbursements Report, Payments statements, Returns Report, and FBA Fee Preview. This guide covers what each one tells you, where to find it, and when to check it.
Key takeaways
- The Sales and Traffic Report is your fastest way to spot why revenue changed.
- Session Percentage (your conversion rate) matters more than total sessions.
- The Search Term Report shows which customer searches are wasting your ad budget.
- The Inventory Health Report directly affects your IPI score and storage fees.
- Most sellers leave reimbursement money unclaimed because they never audit the Reimbursements Report.
- Seller Central has no built-in year-over-year comparison. You have to build it yourself or use a third-party tool.
A real seller's experience with Amazon reports (and what finally fixed it)
One Reddit user shared his experience in r/AmazonSeller after his FBA sales dropped 22% in a single week. He had spent an entire evening clicking through Business Reports, Fulfillment Reports, and Advertising tabs in Seller Central and still had no idea what went wrong. His post title said it all: "So many Amazon reports. How do I find the key ones?"
The reply that got the most votes was simple: "Business Report for sales, Search Term Report for ads, Inventory Health for fees. Everything else is noise until you have those three sorted."
He pulled the Search Term Report for the first time. Seventeen search terms had been spending his ad budget that month, and not one of them had produced a sale. That was his 22%.
Why Amazon's reports are so hard to navigate
Reports in Seller Central are spread across five different menus. Some data appears in multiple places under different names, and the same metric can have a different definition depending on which report you're reading.
The most common mistake sellers make is checking total revenue and nothing else. That tells you what happened; it doesn't tell you why. To diagnose a sales drop, you need to look at sessions, conversion rate, and ad performance together.
If you've ever stared at a revenue dip with no idea where to start, the SellerQI account diagnostic surfaces the most likely causes automatically every 24 hours, ranked by revenue impact.
Where to find every report that matters
| Report | Location in Seller Central | Check how often |
|---|---|---|
| Sales and Traffic by Date | Reports › Business Reports | Daily |
| Detail Page Sales by ASIN | Reports › Business Reports | Weekly |
| Inventory Health Report | Reports › Fulfillment | Weekly |
| Search Term Report | Advertising › Campaign Manager | Weekly |
| FBA Customer Returns | Reports › Fulfillment › Returns | Monthly |
| Payments statements | Payments › All Statements | Every settlement |
| FBA Reimbursements | Reports › Fulfillment › Payments | Quarterly |
| FBA Fee Preview | Reports › Fulfillment | Per new product |
| Stranded Inventory | Inventory › Fix Stranded Inventory | Weekly |
| Seller Performance | Performance › Account Health | Weekly (FBM only) |
Business Reports: start here every day
Sales and Traffic Report (by date)
This is the report most sellers should open first. It shows store-wide performance across a date range you choose. The key columns are:
- Ordered Product Sales: total revenue from customer orders.
- Sessions: unique visitors to your listings in a 24-hour window.
- Session Percentage: your conversion rate (units ordered divided by sessions).
- Buy Box Percentage: share of views where you held the Buy Box.
Session Percentage is the most important number on this page. If sessions are up but conversion is down, the problem is your listing (images, price, reviews, or a new competitor). If sessions are falling and conversion is steady, you have a traffic problem, usually a drop in organic rank or a change in ad spend.
Detail Page Sales and Traffic by ASIN
This is the same data broken down by individual products. Sort by Session Percentage to find your worst-converting ASINs, then cross-reference with your Search Term Report to check whether you're also spending ad budget on those same listings without getting returns.
A low-converting ASIN with active ad spend is usually a listing-health problem rather than a traffic problem. Fix the listing first before adjusting bids.
Inventory reports: where storage costs get out of control
Inventory Health Report
This report shows your current FBA stock levels, sell-through rate, weeks of cover, and projected storage costs. It's the report Amazon uses to calculate your Inventory Performance Index (IPI) score.
A sell-through rate below 1.0 means you're storing more than you're selling. Amazon's capacity limits tighten for accounts with low IPI scores, which makes it harder to send in new stock. Check this report weekly, if you're getting unexpected stockout alerts or your IPI is trending down, your sell-through rate is the first number to look at.
Stranded Inventory Report
Stranded inventory is stock sitting in Amazon's warehouse with no active listing. You can't sell it, but you're paying storage fees on it. This happens when a listing gets suppressed or deleted by mistake. Check it weekly, most stranded inventory issues can be fixed in a few minutes once you know they exist. Find it under Inventory › Fix Stranded Inventory.
Advertising reports: your biggest lever for profit
Search Term Report
This report shows every customer search query that triggered one of your ads and received at least one click. It answers questions the Campaign Manager dashboard cannot:
- Which exact searches are generating your conversions?
- Which searches are spending your budget without producing sales?
- Which competitor search terms are you winning or losing?
Pull this report weekly if you're running active campaigns. Without it, you have no way to add the right negative keywords or double down on the terms that convert. For a structured approach, the Amazon PPC audit checklist walks through exactly how to use this report to cut wasted spend.
Targeting Report
Where the Search Term Report shows what customers typed, the Targeting Report shows performance at the keyword level inside your campaigns. Use it to identify which keywords are above your target ACoS (reduce their bids) and which ones are below target (they could handle a higher bid).
Payments reports: what you actually got paid
The revenue number in your Business Reports reflects ordered product sales. It is not what Amazon deposited into your bank account. Amazon's settlement statements are where actual cash flow lives.
Go to Payments › All Statements to see every settlement period. Each statement shows total sales, total fees, and the net disbursement. Use this figure, not Business Report revenue, when talking to accountants, lenders, or investors. For a breakdown of what Amazon deducts from every payment, the guide to FBA fees and hidden costs covers every fee category and where to check for overcharges.
FBA Reimbursements Report: money most sellers leave unclaimed
Amazon's warehouses lose and damage inventory regularly. Amazon's policy is to reimburse sellers for these losses, but you have to find the cases yourself. The FBA Reimbursements Report shows reimbursements that have already been issued. To find the ones you're owed but haven't received, cross-reference it against your inventory adjustment and returns reports.
Filing deadline
Amazon won't process reimbursement claims older than 18 months. The clock starts from the date the incident occurred, not the date you discover it. Audit at minimum once per quarter.
Returns Report: what your return rate is actually telling you
A return rate above 5 to 8 percent on a single ASIN is a signal worth investigating. The FBA Customer Returns Report shows the customer-selected return reason for every return, which tells you whether you have a product-quality problem, a listing-accuracy problem, or just normal buyer behavior.
A cluster of "not as described" returns points to a listing issue; a cluster of "defective" returns points to a product or packaging problem. Units returned as unfulfillable should also be checked against your Reimbursements Report to confirm Amazon paid you for them. If your listings have high return rates, check your copy for Amazon restricted words or misleading claims that might be setting false expectations for buyers.
FBA Fee Preview Report: check this before every launch
The FBA Fee Preview Report shows what fulfillment fees you can expect to pay per ASIN, based on the size and weight Amazon has on file for that product. It's not a billing document, but it's essential for margin calculations before launch.
A product that falls into the "large standard" fee tier instead of "small standard" can have fulfillment fees that are 40 to 60 percent higher. Check this report before you finalize packaging on any new product. For a full picture of unit economics, including fees, ad spend, and returns, the ASIN profit dashboard in SellerQI calculates true per-ASIN profitability without spreadsheet work.
The report Amazon doesn't have: year-over-year comparison
Seller Central has no built-in year-over-year comparison view. You can set custom date ranges, but there's no one-click toggle to compare this month to the same month last year.
Most sellers work around this by downloading two date-range CSVs and combining them in Excel. The faster option is a tool that maintains historical snapshots and builds the comparison automatically. SellerQI stores your historical account data continuously, so you can see whether a drop in sales is a real trend or just a seasonal pattern, without building the comparison yourself.
Three mistakes sellers make with these reports
1. Using ordered date instead of shipped date for accounting
Business Reports use ordered dates by default. A December 31 order shows in December's numbers even if it ships in January. If your accounting software uses shipped or invoiced dates, you'll see discrepancies every month. Align your date logic across all systems.
2. Confusing sessions with page views
Sessions count unique visitors in a 24-hour window. One person who visits your listing three times counts as one session but three page views. Conversion rate is calculated against sessions, not page views, using page views as the denominator makes your rate look artificially low.
3. Downloading in-browser data instead of the raw CSV
The table you see inside Seller Central is limited to fewer rows and can't be sorted on multiple columns. Always download the CSV or spreadsheet version. The real analysis happens in Excel, Google Sheets, or a tool that processes it automatically.
Frequently asked questions
What's the most important report in Amazon Seller Central?
The Sales and Traffic Report. It brings sales, sessions, conversion rate, and Buy Box percentage together in one place.
How often should I be checking my Amazon reports?
Check your Sales Report daily. Inventory and Search Term Reports are fine on a weekly basis. Staying on top of these helps you catch problems before they start hurting sales.
Which report helps cut down wasted PPC spend?
The Search Term Report. It shows you exactly which customer searches are costing you money without leading to sales.
Which report flags inventory issues?
The Inventory Health Report. It tracks your sell-through rate, excess stock, and storage fees so you can spot problems early.
Can Amazon seller reports be automated?
Yes. Third-party tools can automate them, saving you the time of manually pulling sales, inventory, PPC, and reimbursement data.
Conclusion
Most sellers check revenue and stop there. The reports above give you the full picture: why revenue changed, which products are dragging down performance, where ad spend is wasted, and where Amazon owes you money.
Start with the Sales and Traffic Report and Inventory Health Report if you're new to this. Add the Search Term Report once you're running campaigns. Run the reimbursements audit every quarter.