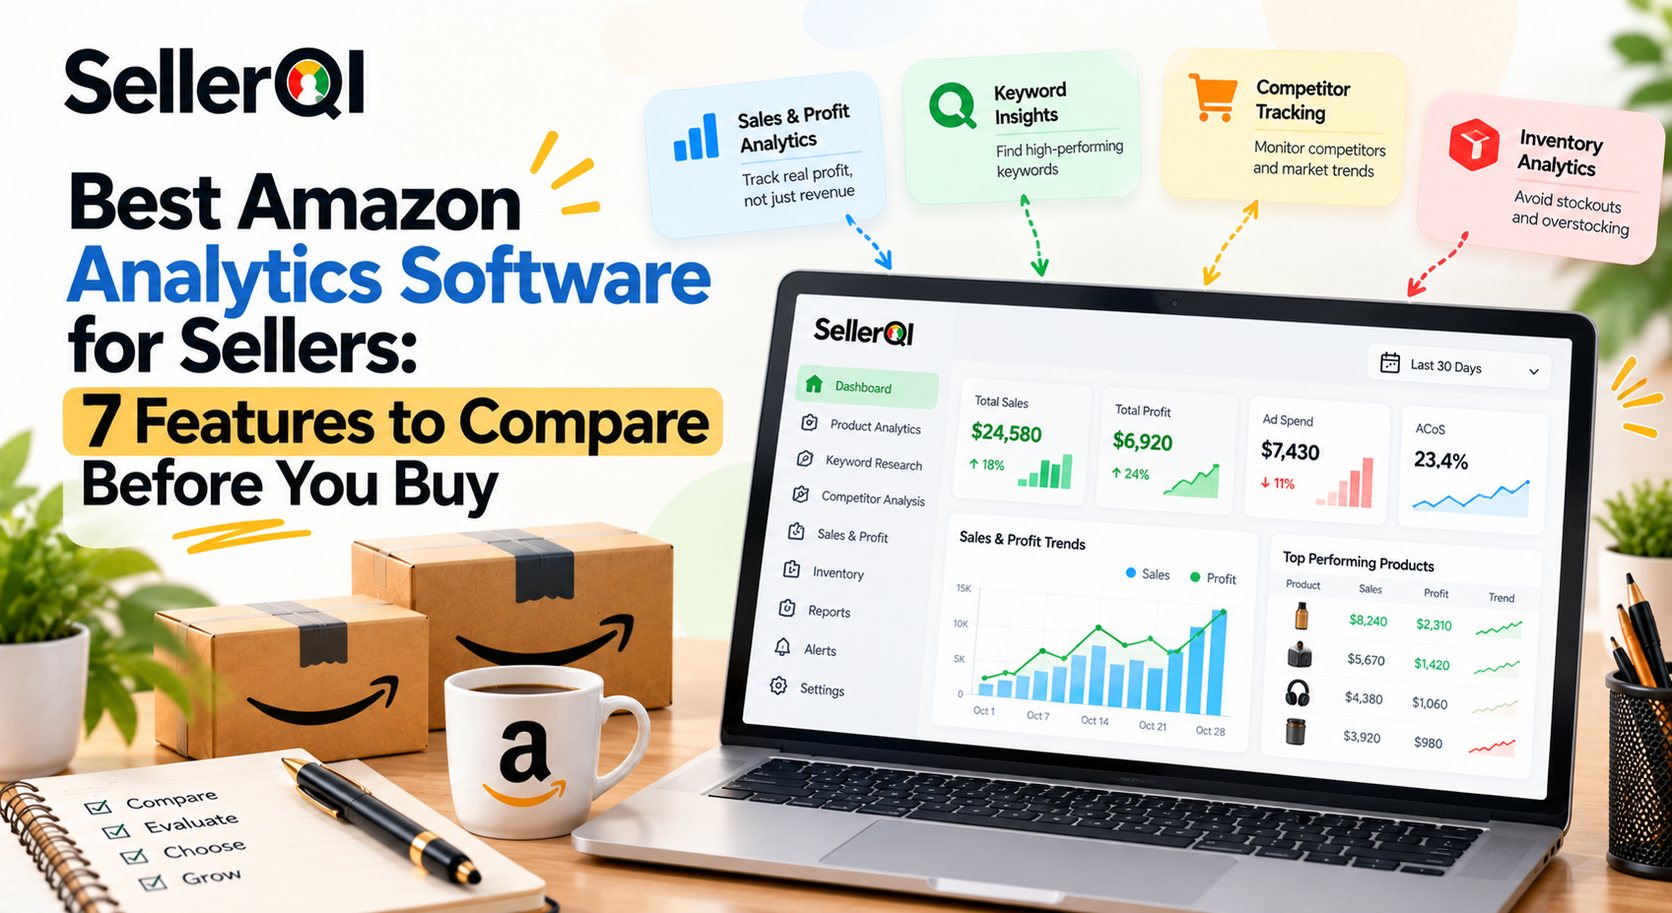
The best Amazon analytics software for sellers helps you connect sales, advertising, product costs, inventory, and account performance to make better business decisions. Before subscribing, compare seven essential features: ASIN-level reporting, product profitability, advertising analytics, inventory insights, listing and account monitoring, data refresh frequency, and marketplace coverage. The right software should show not just what happened, but what needs your attention next.
Choosing an Amazon analytics platform is not simply about finding a dashboard with the most charts. Some tools specialize in product research, others focus on advertising or sales forecasting, and some help sellers identify profit leaks across their existing accounts.
The challenge is finding a solution that matches your selling model, reporting requirements, and growth stage without paying for features you rarely use.
This guide explains the seven features worth comparing, how to evaluate Amazon analytics software before subscribing, and which capabilities matter most for serious FBA sellers.
What Is Amazon Analytics Software?
Amazon analytics software for sellers collects and organizes seller data to help businesses understand sales performance, advertising efficiency, product profitability, inventory movement, and operational issues. Depending on the platform, it may provide dashboards, downloadable reports, automated alerts, historical trends, and recommendations based on account data.
For example, Amazon Seller Central provides native business reports for reviewing sales, traffic, and individual product performance. Third-party Amazon business analytics software can combine additional information, such as advertising costs, product expenses, refunds, and inventory signals, to give sellers a broader view of their business.
Different platforms solve different problems. A product research tool may help estimate market demand, while an analytics platform connected to your own seller account can help explain why an existing ASIN is losing sales or profit.
The best choice depends on which decisions you need to make more accurately and efficiently.
What Features Must Amazon Seller Analytics Software Include?
Amazon seller analytics software should include seven core features that help sellers measure product performance, understand profitability, optimize advertising, manage inventory, detect account issues, receive timely data, and compare marketplaces. Each feature addresses a different part of the business, so evaluate them together rather than choosing a tool based on a single attractive dashboard.
1. ASIN-Level Sales and Traffic Reporting
ASIN-level reporting breaks down performance by individual products instead of showing only total account sales. It helps sellers identify which products generate revenue, which are losing traffic, and which listings need closer investigation.
Look for metrics such as:
- Ordered product sales and units ordered
- Sessions and page views
- Conversion-related metrics
- Product and variation-level performance
- Comparisons across selected periods
For example, your account revenue may increase even while one of your best-selling ASINs experiences declining traffic. A product-level dashboard helps you identify that decline before it becomes hidden inside the account-wide total.
An effective Amazon seller reporting software solution should make it easy to move from overall performance to the individual products behind the numbers.
2. True Product Profitability and Margin Tracking
Sales revenue does not tell you how much money a product actually earns. Product profitability reporting combines sales with relevant expenses to show whether an ASIN generates a healthy margin after costs.
Check whether the tool accounts for:
- Product cost or cost of goods sold (COGS)
- Amazon referral and fulfillment fees
- Advertising spend
- Returns and refunds
- Storage charges and applicable promotions
SellerQI's ASIN Profit Dashboard focuses on product-level profit and margin after included costs, helping sellers identify products that appear successful on revenue but may be unprofitable after expenses.
This feature is especially important when deciding which products to scale, reprice, or investigate. Always verify which cost categories are included and whether the cost data you provide is complete.
3. Advertising Performance and PPC Analytics
Advertising analytics helps sellers understand how paid campaigns contribute to sales and whether that spend is sustainable. Without product-level advertising data, a seller may increase a campaign budget without realizing that the advertised product already has a weak profit margin.
Useful capabilities include:
- Advertising spend and attributed sales
- Advertising Cost of Sales (ACoS)
- Total Advertising Cost of Sales (TACoS), where supported
- Search-term and keyword performance
- High-spend terms that generate few or no orders
- Campaign and ASIN-level performance comparisons
A useful Amazon seller metrics tracking tool should help you connect advertising efficiency with overall product performance. ACoS alone does not establish profitability because it excludes other product costs and may not reflect total organic sales.
For example, a campaign can show improving ACoS while the product's margin remains weak due to fulfillment fees, returns, or rising product costs.
4. Inventory Insights and Stock Monitoring
Inventory analytics helps sellers understand whether they have enough stock to meet demand without tying up too much cash in slow-moving products. Depending on the tool, it may include stock levels, sales velocity, restock estimates, inventory aging, and excess-stock alerts.
Look for features that help you:
- Identify products at risk of stocking out
- Find slow-moving or excess inventory
- Compare sales velocity with available stock
- Review inventory aging and storage-related costs
- Plan replenishment using realistic lead times
Inventory forecasting is not equally important for every seller. A small catalog with stable demand may need basic stock monitoring, while a large catalog with long supplier lead times may benefit from more advanced forecasting.
Choose inventory features based on how often stock availability or overstock affects your sales and cash flow.
5. Listing Health and Account Issue Detection
Sales can decline because of more than advertising or demand. Missing listing information, suppressed products, indexing issues, and account warnings may reduce visibility or prevent customers from purchasing.
A broader analytics platform may include alerts or diagnostic checks for:
- Suppressed or incomplete listings
- Missing listing keywords or indexing issues
- Account-health warnings
- Changes affecting product availability
- Other issues that may affect sales or revenue
SellerQI includes listing health scanning and account-health monitoring alongside its PPC and profitability diagnostics. These capabilities help sellers investigate operational problems that a sales-only dashboard may not explain.
Do not assume every Amazon product analytics tool includes these checks. Some platforms focus on reporting, while others are built to identify problems and prioritize corrective actions.
6. Data Refresh Frequency, Alerts, and Actionable Insights
A dashboard is only useful if its data is sufficiently current for the decisions you need to make. Some reports refresh frequently, while others depend on scheduled data processing, advertising attribution windows, or marketplace reporting delays.
Before choosing software, check:
- How often each metric is refreshed
- Whether the refresh schedule differs by report
- Whether important changes trigger alerts
- Whether historical comparisons are available
- Whether the platform explains why an issue was flagged
SellerQI states that its account diagnostic engines run every 24 hours, with alternate-day alert emails for issues requiring attention. That schedule may suit sellers who want regular diagnostics, but sellers who need more frequent monitoring for specific metrics should check the tool's actual update intervals.
A strong platform should also help prioritize findings. A list of 100 issues is less useful than a clear explanation of which problems may have the greatest impact and what to investigate first.
7. Marketplace Coverage, Integrations, and Reporting Flexibility
Marketplace coverage matters when you sell in more than one Amazon region. Data definitions, currencies, fees, and available reports can differ between marketplaces, so confirm that the platform supports the regions where your business operates.
Evaluate whether the Amazon seller metrics tracking tool offers:
- Support for your required Amazon marketplaces
- Appropriate currency and marketplace-specific reporting
- Authorized seller-account integrations
- Clear permissions and data-access explanations
- Exportable reports or historical comparisons
- Team access or reporting options, if needed
A seller operating in the US, UK, and Australia may need consolidated reporting across several marketplaces. A seller operating in only one region may prefer a simpler tool with deeper reporting for that marketplace.
Also distinguish between an analytics tool and amazon seller dashboard software that reads and analyzes account data and a tool that can modify listings, campaigns, or prices. Understand what actions the software can perform before granting account access.
How to Evaluate Amazon Analytics Software Before Subscribing?
Evaluate Amazon analytics software by testing it against your actual business needs, verifying its data quality, checking refresh frequency and marketplace support, and scoring how well it covers your essential workflows. A short trial or sample-data review can reveal more about a platform's usefulness than a long list of advertised features.
Follow these five steps before making a decision.
Step 1: Define the Decisions You Need the Tool to Support
Start with the problems you want to solve. Do you need more accurate product profitability, better PPC visibility, faster sales reporting, inventory forecasting, or listing diagnostics?
Write down your three most important requirements. This will help you avoid paying for a broad feature set that does not address your biggest operational challenges.
Step 2: Test the Software With Your Own Account Data
Where a trial, demo, or account connection is available, compare the platform's results with relevant Seller Central reports and your own records.
Check a sample of ASINs with different performance levels. Include a profitable product, a low-margin product, and a product with unusual advertising or return activity.
Confirm that the platform's calculations make sense and investigate differences rather than assuming either report is automatically correct.
Step 3: Verify Data Refresh Frequency and Metric Definitions
Ask how frequently sales, advertising, inventory, and profitability data update. Check whether the tool explains its metric definitions, attribution windows, and historical reporting limits.
Make sure you understand the difference between ordered sales, shipped sales, advertising-attributed sales, and net profit. Those metrics are not interchangeable, and differences in definitions can create misleading comparisons.
Step 4: Confirm Marketplace Coverage and Integration Requirements
Check that the tool supports your required marketplaces and has the integrations needed for your account. Review the permissions requested, data-access policies, and whether all desired features are available in the relevant marketplace.
If you sell across multiple regions, test how the platform handles currencies and marketplace-specific fees before relying on consolidated reports.
Step 5: Score the Tool Against Your Priorities
Use the scorecard below to compare shortlisted platforms. Rate each criterion from 1 to 5, where 1 means poor or unavailable and 5 means it fully meets your needs.
| Evaluation criterion | What to verify | Your rating (1–5) |
|---|---|---|
| ASIN-level reporting | Can you analyze individual products and variations? | ___ / 5 |
| Profitability accuracy | Are relevant fees, ad spend, refunds, and product costs included? | ___ / 5 |
| PPC analytics | Can you connect advertising performance with product results? | ___ / 5 |
| Inventory insights | Does it help identify stock risks and slow-moving inventory? | ___ / 5 |
| Alerts and diagnostics | Does it surface important problems and explain next steps? | ___ / 5 |
| Data refresh frequency | Are update intervals suitable for your workflow? | ___ / 5 |
| Marketplace coverage | Does it support your regions and reporting needs? | ___ / 5 |
Add the scores for a maximum of 35. Use the total as a comparison aid, not as the only deciding factor. A tool that scores highly overall may still be unsuitable if it lacks one essential feature, such as profitability reporting or support for your primary marketplace.
When Is SellerQI Worth Considering?
SellerQI is worth evaluating if your priority is to identify issues affecting existing Amazon products, rather than focusing exclusively on product discovery or sales reporting.
Its platform combines an ASIN Profit Dashboard with PPC Waste Finder, Listing Health Scanner, Reimbursement Recovery, Keyword Intelligence, and Account Health Monitor. These features can help sellers investigate unprofitable ASINs, wasted advertising spend, listing issues, and possible reimbursement opportunities.
SellerQI's diagnostic tools are available without a subscription fee, while optional services are quoted separately. Review the current SellerQI features to confirm whether the available diagnostics match your needs.
If your main requirement is advanced market research, keyword discovery, or inventory forecasting, compare SellerQI with platforms that specialize in those workflows before making a final decision.
Conclusion: Choose Analytics Software That Helps You Act
The best Amazon analytics software for sellers is the platform that provides reliable data for your decisions, highlights the problems that matter, and fits your existing workflow. Start by comparing the seven core features: ASIN-level reporting, product profitability, PPC analytics, inventory insights, listing and account diagnostics, data refresh frequency, and marketplace coverage.
Before subscribing, test the tool with your own data, verify its calculations, and use the scorecard to compare shortlisted options. Avoid choosing solely on the number of features or the appearance of its dashboard.
For sellers who want to understand product-level profitability while investigating advertising waste, listing issues, and account risks, SellerQI is worth evaluating. The aim is not simply to collect more data; it is to make better decisions about which products to scale, which problems to fix, and where to protect your margins.
Frequently asked questions
Which Amazon analytics software delivers the most accurate insights?
The most accurate Amazon analytics software is the one that uses reliable source data, clearly defines its metrics, updates information at an appropriate frequency, and calculates profitability using complete cost inputs. Accuracy should be tested against your own Seller Central reports and financial records. SellerQI is worth evaluating for ASIN-level profit and account diagnostics, while other platforms may better suit sellers prioritizing product research or broader keyword analytics.
Which is the best Amazon analytics software for serious FBA sellers?
SellerQI is a strong choice for serious FBA sellers who want to improve product profitability and identify issues affecting account performance. Its features include an ASIN Profit Dashboard, PPC Waste Finder, Listing Health Scanner, Reimbursement Recovery, and Account Health Monitor. These tools help sellers track product-level profit, identify advertising waste, uncover potential reimbursement opportunities, and investigate listing issues. For sellers who want actionable insights beyond basic sales reports, SellerQI brings essential Amazon account diagnostics together in one platform.
What should Amazon business analytics software include for a growing brand?
Amazon business analytics software for a growing brand should combine sales reporting, ASIN-level performance, product profitability, advertising analysis, inventory insights, and marketplace coverage. Growing brands should also check whether the platform can handle their catalog size, historical reporting needs, and team workflows without making routine analysis unnecessarily complicated.
How is Amazon seller dashboard software different from Seller Central?
Amazon seller dashboard software may combine data from several reporting areas into one interface and add calculations, alerts, or diagnostics. Seller Central provides native tools and reports for sales, traffic, payments, inventory, and account management. The main difference depends on the third-party platform: some add analysis and recommendations, while others focus primarily on consolidating data.
Can Amazon seller reporting software show profit for each ASIN?
Yes, some Amazon seller reporting software can calculate product-level profit when it has access to sales and relevant cost data. Verify whether the tool includes product costs, Amazon fees, advertising spend, returns, refunds, storage, and promotions. Missing costs can make an ASIN appear more profitable than it actually is.
How often should I review metrics in an Amazon seller metrics tracking tool?
Review sales, advertising spend, stock risks, and urgent account alerts daily when your business activity warrants it. Analyze ASIN traffic, conversion, and campaign performance weekly, then review profit margins and longer-term trends monthly. The ideal schedule depends on sales volume, advertising activity, inventory risk, and the refresh frequency of your data.
Is an Amazon product analytics tool useful for low-volume sellers?
An Amazon product analytics tool can be useful for low-volume sellers if it helps them understand product demand, conversion, and profitability without adding unnecessary complexity. Sellers with a small catalog may begin with Seller Central reports and a simple cost-tracking process, then add third-party analytics when manual reporting becomes time-consuming or they need deeper ASIN-level insights.