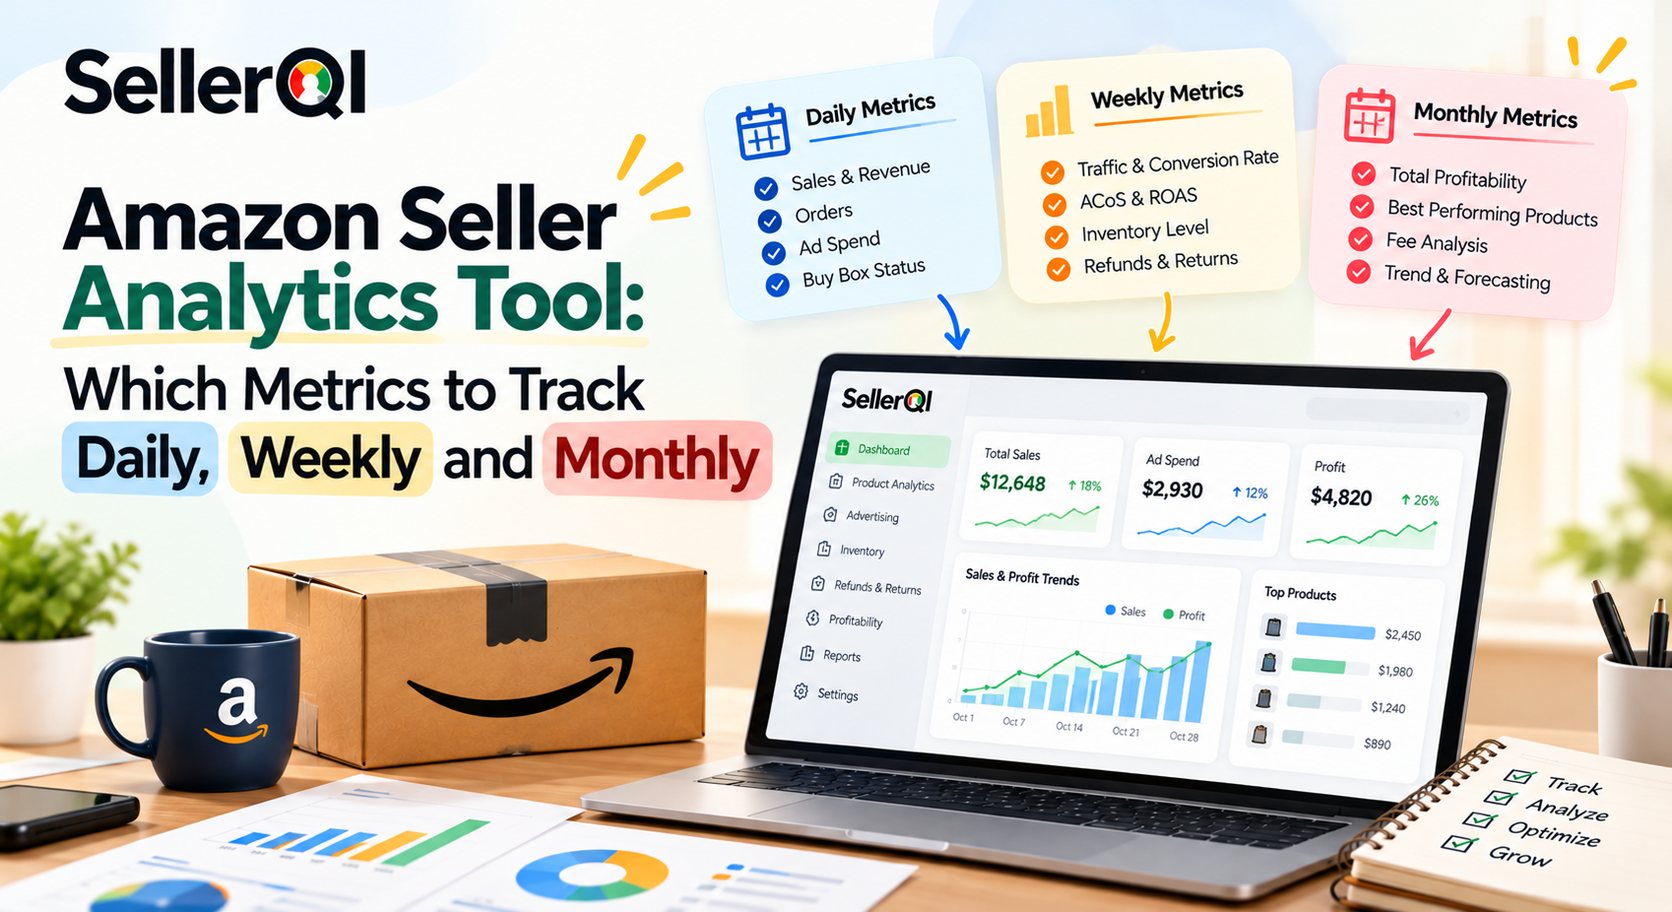
An Amazon seller analytics tool helps sellers monitor sales, revenue, advertising performance, product profitability, and account health to make better business decisions. The most effective tracking routine combines daily checks for sudden changes, weekly reviews of product and campaign performance, and monthly analysis of profit margins, growth trends, and inventory efficiency.
Tracking every available metric can create more confusion than clarity. The goal is to identify which numbers need immediate attention, which reveal patterns over time, and which help you decide where to invest or cut costs.
This guide explains the Amazon seller metrics to track daily, weekly, and monthly, how to analyze ASIN-level performance, and what to look for when choosing an analytics tool for your business.
Why Do Amazon Sellers Need an Analytics Tool?
An Amazon sales analytics tool helps sellers understand not just how much they sell, but why sales change and whether that revenue translates into profit. Seller Central provides useful reports, but sellers may need to combine sales, advertising, inventory, and cost data to understand overall performance.
For example, revenue might increase while profit falls because advertising costs rise faster than sales. Another product may receive plenty of traffic but convert poorly, suggesting an issue with its listing, price, or offer. Looking at the right metrics together makes these problems easier to identify.
An effective Amazon sales analytics tool should help you:
- Track revenue, orders, and units sold.
- Identify products with declining traffic or conversion.
- Monitor advertising spend and campaign efficiency.
- Understand true product-level profitability after costs.
- Detect inventory risks and avoidable operational losses.
- Compare current performance with previous periods.
- Prioritize actions based on their potential impact on revenue and profit.
The purpose of Amazon seller analytics tool is to turn account data into practical decisions—not simply to create another dashboard full of numbers.
Which Amazon Seller Metrics Should You Track Daily, Weekly and Monthly?
The right amazon seller monitoring software tracking frequency depends on how quickly a metric can affect your business and how much data is needed to interpret it. Sales drops, advertising waste, and account alerts deserve frequent attention, while profitability trends and long-term growth are easier to evaluate over a longer period.
Use this schedule as a starting point and adjust it to your catalog size, advertising activity, inventory position, and sales volume.
| Frequency | Metrics to track | What to look for | Main decision |
|---|---|---|---|
| Daily | Sales revenue, units ordered, advertising spend, ACoS, conversion changes, account alerts, inventory risks | Sudden drops, unusual spend, suppressed listings, stockout risks | Investigate urgent issues and protect sales |
| Weekly | ASIN sales trends, sessions, conversion rate, TACoS, search-term performance, Buy Box percentage, return patterns | Underperforming products, wasted ad spend, traffic and conversion problems | Optimize listings, campaigns, and inventory |
| Monthly | Net profit, profit margin, revenue growth, contribution by ASIN, inventory turnover, refund trends, total advertising efficiency | Products losing money, recurring cost increases, seasonality, growth opportunities | Reprice, scale, reduce spend, or reconsider inventory |
These are recommended review frequencies, not mandatory rules for every seller. A fast-moving account may need more frequent monitoring, while low-volume sellers may get more reliable insights from weekly comparisons.
Daily Metrics: What Should Amazon Sellers Check Every Day?
Daily monitoring is about spotting changes before they become expensive problems. You do not need to analyze every product in depth each morning; start with a quick performance check, then investigate unusual changes in sales, advertising, inventory, or account health.
1. Ordered Product Sales and Units Ordered
Sales revenue tells you how much customers ordered, while units ordered helps explain whether a revenue change came from selling more products or from changes in average selling price. Track both because revenue alone can hide declining unit demand.
If sales fall sharply, compare the same period with recent days and check whether the change affects the whole catalog or only a few ASINs. Also consider promotions, seasonality, stock availability, and the difference between ordered and shipped sales when comparing reports.
2. Advertising Spend and ACoS
Advertising spend shows how much you are paying to acquire traffic, while ACoS measures advertising spend relative to advertising-attributed sales. These metrics help you identify campaigns or search terms consuming budget without generating enough attributed revenue.
For example, if a campaign spends $100 and generates $250 in attributed sales, its ACoS is 40%. Whether that is acceptable depends on the product's margin and business objective. A high ACoS may be reasonable during a launch but unsustainable for an established product with thin margins.
Review sudden spend increases, high-spend search terms without sales, and campaigns whose performance changes unexpectedly.
3. Conversion Rate Changes
Conversion rate indicates how effectively listing traffic turns into orders. When sessions remain stable but conversion falls, investigate listing content, price competitiveness, reviews, delivery promises, and offer availability before assuming the problem is insufficient traffic.
Use consistent definitions when comparing reports. Amazon's Business Reports provide session and order-related metrics, while advertising reports use their own attribution windows and conversion definitions. Those numbers may not match exactly.
4. Inventory and Account Alerts
A product can lose sales even when demand remains strong if inventory runs low, a listing becomes suppressed, or an account issue affects its availability. Daily alerts help sellers identify problems that may need immediate attention.
Check for low-stock warnings, stranded inventory, listing suppression, Buy Box changes, and account-health notifications. The appropriate response depends on the alert, but the key is to investigate the cause before it affects a larger portion of your business.
Weekly Metrics: How Do You Evaluate Amazon Sales Performance?
Weekly analysis helps sellers move beyond isolated daily fluctuations and understand which products, campaigns, and listings need improvement. Compare a complete week with an appropriate previous period, while accounting for promotions, seasonality, and changes in advertising activity.
1. ASIN-Level Sales and Traffic
Amazon sales performance tracking becomes more useful when you break down results by ASIN instead of looking only at account-wide revenue. A strong overall sales figure may hide products that are losing traffic, converting less effectively, or becoming less important to total revenue.
Review sessions, page views, units ordered, sales, and conversion-related metrics for your leading products. Identify which ASINs are growing, which are declining, and which have enough traffic to justify a deeper investigation.
2. TACoS and Advertising Efficiency
ACoS measures advertising spend against attributed ad sales, whereas TACoS measures advertising spend against total sales, including organic sales. Reviewing both helps sellers understand campaign efficiency and the broader relationship between advertising and business revenue.
For example, a campaign's ACoS may improve while total sales remain flat. That could indicate more efficient advertising, but it does not automatically mean the business is growing. Weekly TACoS trends can help you evaluate whether advertising spend is becoming more or less significant relative to overall sales.
Avoid judging either metric in isolation. Consider profit margin, product lifecycle, organic demand, and the role of advertising in customer acquisition.
3. Search-Term and Campaign Performance
Search-term analysis helps you find keywords that generate sales and terms that spend money without producing meaningful results. Review search terms, clicks, spend, attributed sales, and conversions to identify where campaigns may need adjustments.
A useful weekly review asks three questions:
- Which search terms generated sales at an acceptable efficiency?
- Which search terms spent money without generating orders?
- Which promising terms need more data before you make a change?
This approach helps you make controlled adjustments rather than reacting to one poor day of campaign performance.
4. Buy Box Percentage and Offer Performance
Buy Box or Featured Offer performance can influence whether customers purchase your offer, especially when competing sellers sell the same product. A decline in the percentage of eligible page views where your offer wins the Featured Offer deserves investigation.
Review pricing, stock availability, delivery speed, and seller performance factors where relevant. Do not assume every decline has the same cause; evaluate the offer and competitive context before changing prices.
Monthly Metrics: How Do You Measure Long-Term Seller Performance?
Monthly analysis reveals whether your business is becoming more profitable and sustainable. It allows you to evaluate revenue growth, product margins, inventory efficiency, and recurring costs without giving too much weight to daily noise or short-term fluctuations.
1. Net Profit and Profit Margin
Revenue is not the same as profit. To understand the financial performance of an Amazon business, account for product costs, referral and fulfillment fees, advertising, refunds, storage, promotions, and other relevant expenses.
A product with strong sales may still produce a weak margin after all costs are included. Monthly Amazon seller revenue tracking should therefore compare revenue with the expenses needed to generate it.
For a basic calculation:
Profit margin = (Net profit ÷ Net sales) × 100
If a product generates $10,000 in net sales and $2,000 in net profit, its profit margin is 20%. This figure is only meaningful if the underlying sales and cost data are complete and use consistent accounting assumptions.
2. Revenue Growth and Sales Trends
Compare monthly sales with the previous month and, where possible, the same period last year. Month-over-month growth helps you understand recent momentum, while year-over-year comparison can help account for seasonal buying patterns.
Investigate whether growth comes from higher unit sales, price changes, new products, increased advertising, or stronger conversion. Revenue growth driven primarily by heavy discounts or inefficient advertising may not improve profitability.
3. Product Profitability by ASIN
Monthly reviews should identify which ASINs contribute the most profit and which consume resources without producing an acceptable return. Compare profit, margin, ad spend, returns, and storage-related expenses for each product.
Use these insights to group products into three categories:
- Scale: Products with healthy margins, reliable demand, and room for additional investment.
- Optimize: Products with potential but weak conversion, high advertising costs, or thin margins.
- Investigate or reduce: Products with persistent negative profit, high return rates, or excess inventory.
A product should not be discontinued based on one weak month alone. Check data quality, seasonality, launch costs, and recent changes before making a major decision.
4. Inventory Turnover and Excess Stock
Inventory performance affects cash flow, storage expenses, and the ability to meet demand. Monthly reviews should compare available stock with sales velocity and expected replenishment timelines.
Look for slow-moving products, excess stock, and items at risk of running out. The right action may be to adjust purchasing, improve listing performance, or run a controlled promotion—but discounting is not always the best solution if it further damages margins.
Amazon Analytics Tool to Analyze ASIN Performance Deeply
An Amazon analytics tool for deep ASIN performance analysis breaks down each product's traffic, sales, advertising, costs, and profitability so sellers can identify what is driving results and which actions could improve performance. ASIN-level analysis is more actionable than store-wide averages because it shows how individual products contribute to revenue and profit.
| Metric | What it shows | How often to check |
|---|---|---|
| Ordered product sales by ASIN | Revenue generated by each product | Daily for top sellers; weekly for the full catalog |
| Units ordered | Product demand and changes in sales volume | Daily or weekly |
| Sessions and page views | Traffic reaching the product detail page | Weekly |
| Unit Session Percentage or conversion metric | How effectively listing traffic generates orders | Weekly |
| Advertising spend by ASIN | Advertising costs associated with each product | Daily for active campaigns; weekly for optimization |
| ACoS | Ad spend relative to advertising-attributed sales | Daily for active campaigns; weekly for decisions |
| TACoS | Advertising spend relative to total sales | Weekly |
| Net profit by ASIN | Revenue remaining after included product-level costs | Weekly for exceptions; monthly for broader review |
| Profit margin by ASIN | Profit relative to net sales | Monthly, with alerts for major changes |
| Refund and return trends | Product quality, customer-experience, or profitability concerns | Weekly or monthly, depending on volume |
| Inventory position and sell-through | Stock availability and how quickly inventory sells | Weekly; daily for stockout risks |
| Storage and other fulfillment costs | Costs that can reduce product-level profit | Monthly, or more frequently when costs change |
The exact metrics available depend on the reports, integrations, marketplace, and analytics tool. Some metrics are updated more frequently than others, and sales reports, advertising reports, and financial records may use different time windows.
How to Turn ASIN-Level Metrics Into Decisions
The value of Amazon seller KPI tracking comes from connecting related metrics rather than interpreting each number separately.
- High sessions, low conversion: Check listing images, pricing, reviews, delivery promises, and offer availability.
- Low sessions, healthy conversion: Investigate traffic sources, keyword visibility, advertising reach, and inventory availability.
- High sales, low profit: Review product costs, fulfillment fees, returns, discounts, and advertising spend.
- High advertising spend, low attributed sales: Examine search terms, targeting, bids, and campaign structure.
- Healthy sales, rising storage costs: Review sell-through, replenishment plans, and slow-moving stock.
- Strong ACoS, weak total profitability: Check TACoS, organic sales, and all product-level costs before increasing ad budgets.
These patterns are starting points for investigation, not automatic diagnoses. The same metric can have different causes depending on the product, season, competition, and stage of the listing.
How to Choose Amazon Seller Analytics Tool?
Choose an Amazon seller analytics tool by checking whether it provides the right product-level metrics, refreshes data often enough, includes complete cost information, connects securely to your account, and turns reports into actionable insights. Use the checklist below for a quick evaluation:
- Does it show metrics at ASIN level? Can you compare individual products instead of relying only on store-wide totals?
- Does it refresh data daily? Is the update frequency clear, and does it suit your monitoring needs?
- Does it track true product profitability? Are relevant fees, ad spend, returns, refunds, storage, and promotions included where supported?
- Does it combine sales and advertising performance? Can you evaluate revenue alongside ACoS, TACoS, and campaign spend?
- Does it flag problems, not just display numbers? Can it surface unusual changes, wasted ad spend, or product-level issues that need attention?
- Does it connect securely and explain its data access? Are permissions, reporting limits, and seller responsibilities clearly stated?
No tool will automatically solve every business problem. Prioritize the metrics and workflows that match your decisions, then verify the accuracy and completeness of the data before relying on it.
How SellerQI Supports Amazon Seller Analytics and KPI Tracking?
SellerQI combines Amazon account diagnostics with product-level profitability insights to help sellers identify issues that deserve attention. Rather than relying only on a static sales dashboard, sellers can use it to review ASIN profitability, advertising waste, listing health, reimbursement opportunities, and account-health signals.
Its ASIN Profit Dashboard brings together product-level revenue and relevant costs, including FBA fees, advertising spend, returns, refunds, storage, and promotions. This helps sellers understand which products are contributing profit and which may be losing money after expenses.
SellerQI also runs account diagnostics every 24 hours and ranks identified issues by estimated revenue impact. Its broader feature set includes a PPC Waste Finder, Listing Health Scanner, Reimbursement Recovery, Keyword Intelligence, and Account Health Monitor. The platform connects through Amazon's Selling Partner API with read-only access; sellers remain in control of actions taken on their accounts.
For sellers who want to make daily checks faster and monthly decisions more informed, the benefit is the ability to review potential problems alongside the product and account data needed to investigate them.
Conclusion: Build a Consistent Amazon Seller Analytics Routine
An effective Amazon seller analytics routine combines daily checks for urgent changes, weekly reviews of traffic and campaign performance, and monthly analysis of profitability and long-term trends. Tracking the right metrics at each interval helps sellers find problems sooner, make better product decisions, and avoid confusing sales growth with actual business growth.
Start with revenue, units ordered, advertising spend, and account alerts. Add ASIN-level traffic, conversion, TACoS, and search-term analysis to your weekly review. Then use monthly profit margins, product costs, and inventory trends to decide which products to scale, optimize, or investigate. Get in touch with SellerQI for more details!
Frequently asked questions
How to analyze Amazon sales data for hidden opportunities?
To analyze Amazon sales data for hidden opportunities, use an Amazon sales analytics tool to compare revenue, units sold, sessions, conversion rates, advertising spend, and profit by ASIN. Look for products with high traffic but low conversion, rising sales but declining margins, or advertising spend that is not generating enough sales. These patterns can reveal opportunities to improve listings, campaigns, and product profitability.
Which Amazon analytics tool shows true product profitability?
SellerQI shows true product profitability when it combines sales with relevant costs, including product costs, Amazon fees, advertising spend, returns, refunds, and storage. SellerQI's ASIN Profit Dashboard helps with Amazon seller revenue tracking by displaying product-level profit and margin after included costs. Check that your product costs are complete and that the tool includes the expense categories relevant to your business.
Which Amazon analytics tool can uncover unprofitable SKUs fast?
SellerQI can uncover unprofitable SKUs by comparing revenue with product costs, fulfillment fees, advertising spend, refunds, and other relevant expenses. SellerQI's ASIN Profit Dashboard supports Amazon seller KPI tracking by helping sellers identify products with weak or negative profit margins. Use these insights to investigate pricing, advertising efficiency, returns, and recurring costs before deciding which products need improvement.
Which metrics help with Amazon sales performance tracking?
Effective Amazon sales performance tracking includes revenue, units ordered, sessions, conversion rate, ACoS, TACoS, net profit, and inventory levels. Review sales and advertising changes daily, analyze traffic and campaign trends weekly, and evaluate profit margins and product growth monthly. Tracking these metrics together helps you understand whether your business is growing sustainably.
How can I identify which Amazon seller metrics to track for each product?
The most useful Amazon seller metrics to track depend on the decision you want to make. Monitor sales, units ordered, advertising spend, and stock risks daily. Review ASIN-level traffic, conversion, and campaign performance weekly. Track net profit, profit margin, returns, and inventory turnover monthly. This routine helps you identify product-level issues without getting distracted by metrics that do not support a clear decision.
Why does Amazon seller revenue tracking show different numbers across reports?
Amazon seller revenue tracking can show different figures because reports may use different date ranges, update schedules, attribution windows, and sales definitions. For example, ordered sales and shipped sales may be recorded in different periods, while advertising-attributed sales follow separate attribution rules. Check each report's definition and reporting period before comparing results or calculating profitability.
How does an Amazon sales analytics tool help improve business decisions?
An Amazon sales analytics tool brings sales, advertising, traffic, and profitability data together to help sellers identify growth opportunities and potential losses. By reviewing these insights at the ASIN level, sellers can prioritize listing improvements, adjust inefficient campaigns, investigate declining margins, and make better inventory decisions. The value comes from turning metrics into specific actions rather than monitoring numbers without a clear goal.