Amazon Automation
Why Your Amazon ACoS Looks Good But You're Still Losing Money

Jimi Patel
9 min read
TL;DR
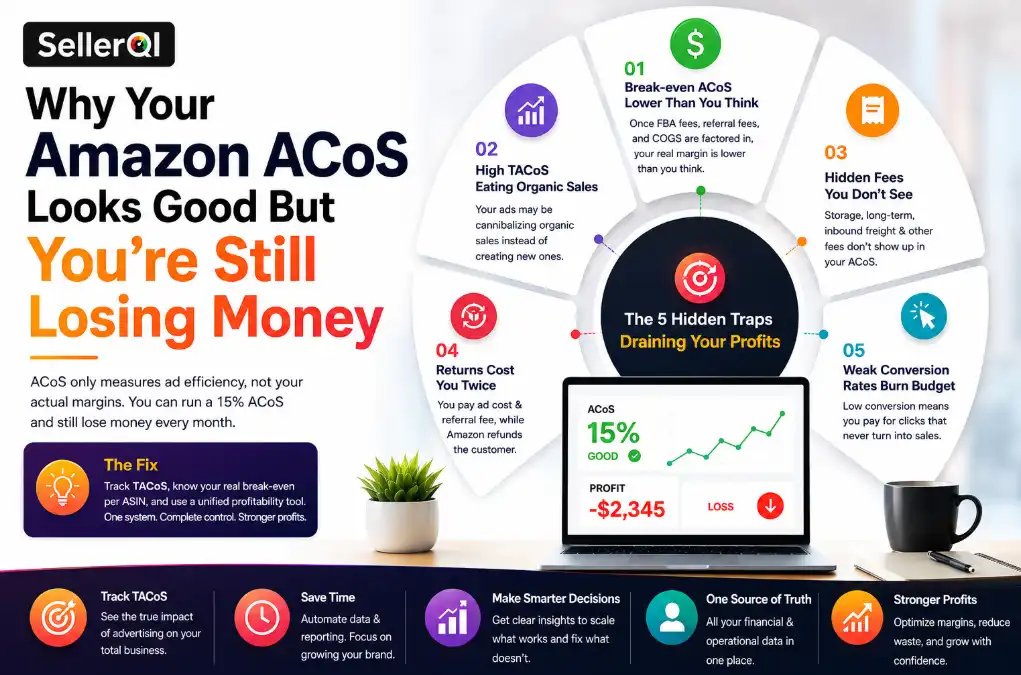
A low ACoS does not mean your Amazon business is profitable. ACoS only measures ad efficiency, not your actual margins. You can run a 15% ACoS and still lose money every month because of five things your dashboard never shows you:
1. Your break-even ACoS is lower than you think once FBA fees, referral fees, and COGS are factored in.
2. In some cases, high TACoS may indicate ads are replacing sales that might have happened organically.
3. Hidden Amazon fees like storage, long-term, and inbound freight never appear in your ACoS calculation.
4. Returns can still leave sellers absorbing ad costs, processing fees, and inventory losses.
5. Weak conversion rates mean you pay for clicks that never turn into sales.
The fix: Track TACoS, know your real break-even per ASIN, and use a unified profitability tool.
Last month, a seller posted in a Reddit thread that stopped a lot of people in their tracks. They had been running Amazon ads for a while. ACoS was consistently under 20%. Their agency kept sending green reports. And then they actually sat down with a spreadsheet, added up every fee, every return, every dollar that quietly left the account, and realized they had been losing money almost the entire time.
Here is the short answer: ACoS was never designed to tell you if your business is profitable. Amazon built it to measure one thing, how efficiently your ads convert spend into attributed sales. That is it. Everything else, your FBA fees, your organic revenue getting cannibalized, your returns, your storage costs, none of that shows up in the number your dashboard celebrates.
So you can run a 15% ACoS and still be bleeding cash every single month. And the worst part is, The standard ads dashboard alone does not show the full profitability picture. It will just keep showing green.
This guide breaks down the five specific reasons this happens, how to spot each one in your own account, and what to actually track if you want your Amazon business to keep the money it makes.
What ACoS Actually Measures (And What It Misses)
ACoS, or Advertising Cost of Sale, measures how much you spent on Amazon PPC ads relative to the sales of those ads directly generated.
ACoS = Ad Spend ÷ Ad-Attributed Sales
Example: $500 spend ÷ $2,500 attributed sales = 20% ACoS
A 20% ACoS looks reasonable. But here is the core problem: that number only captures ad-attributed sales within Amazon's attribution window, which is 7 days for Sponsored Products and 14 days for Sponsored Brands. It tells you nothing about your actual cost structure, your organic revenue, your Amazon fees, or your product returns.
In short: ACoS measures advertising efficiency. It does not measure profitability. That distinction is what costs sellers thousands of dollars every month.
If you've been wondering why Amazon PPC feels so expensive in 2026 even when your ACoS looks fine, this is exactly why. The metric you're watching doesn't show the full picture.
The 5 Hidden Traps Draining Your Profits
Below are the five situations where a good-looking ACoS hides a money-losing business. Each one has a specific fix.
Your Break-Even ACoS Is Lower Than You Think
A 20% ACoS sounds solid, until you realize your actual profit margin after FBA fulfillment fees, Amazon referral fees, and cost of goods sold (COGS) is only 15%.
ACoS is calculated against revenue, not profit. Your ad campaign is only profitable if your ACoS stays below your true profit margin. If your break-even ACoS is 22% but your campaigns are running at 25%, you lose money on every single ad-attributed unit, regardless of what the dashboard tells you.
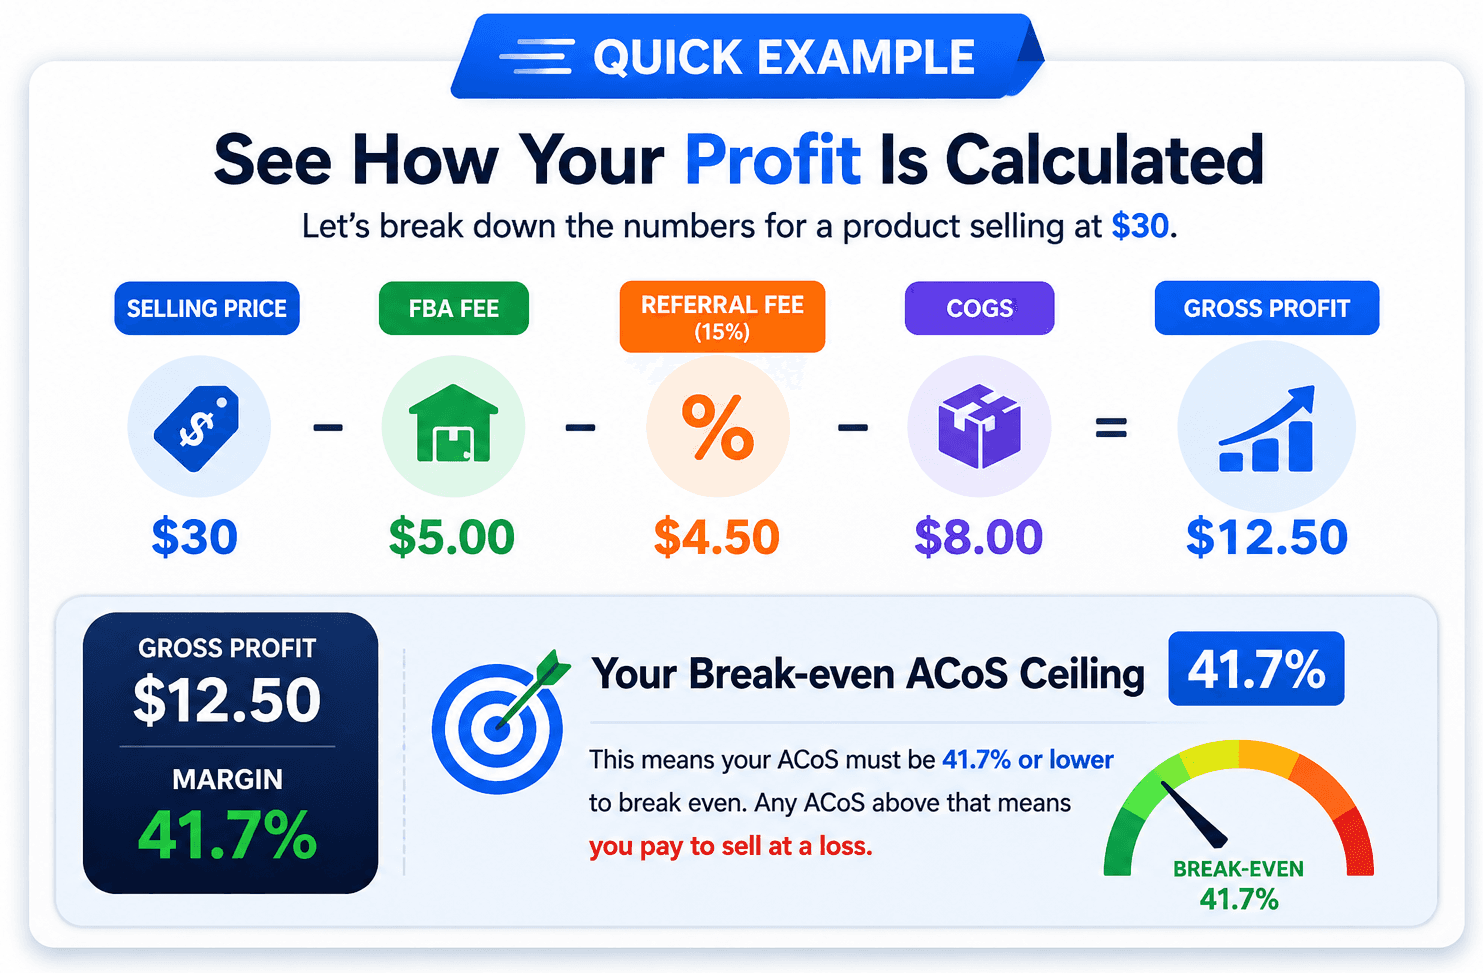
The Fix: Before you set any ACoS target, calculate your actual margin after every fee. That number is your real break-even ACoS ceiling, and no campaign should run above it.
High TACoS Is Silently Eating Your Organic Revenue
TACoS, or Total Advertising Cost of Sale, measures your ad spend against your total revenue, including organic sales. Most Amazon sellers never check this metric, even though it shows where profits are really going.
TACoS = Total Ad Spend ÷ Total Revenue (Organic + Paid)
TACoS reveals what % of your entire business goes to advertising
Here is why this matters. If your ads convert customers who would have found and bought your product organically anyway, your ACoS looks efficient because it captures those attributed sales. But your TACoS tells a different story: you paid for clicks you did not actually need, and your bottom-line profitability took the hit.
A brand spending $10,000 monthly on ads at 15% ACoS can still run 13% TACoS if organic traffic is weak. After accounting for Amazon fees, COGS, storage, and other costs, there is often very little margin left. Healthy TACoS for established products typically sits between 8% and 12%. If yours is climbing above 15%, your advertising may be subsidizing sales you were already earning for free.
Tracking TACoS manually is painful because Amazon's Ads Console and Seller Central don't show it in one place. SellerQI's ASIN-level profit dashboard automatically pulls your ad spend and total revenue together, so you can monitor TACoS alongside ACoS without building a spreadsheet every week.
The Fix: Track TACoS every single month. If it climbs above your target range, investigate before cutting budgets blindly. Cutting ad spend without understanding the TACoS driver often makes things worse, not better.
Amazon's Hidden Fees Never Show Up in Your ACoS
Amazon's ad dashboard subtracts your direct ad spend from your ad-attributed sales and stops there. It does not account for any of the backend costs running silently in the background every single day.
Those costs include:
Referral fees: Typically 8 to 15% of the sale price depending on your product category.
FBA fulfillment fees: Charged per unit based on size and weight tiers.
Monthly inventory storage fees: Multiply fast with slow-moving or seasonal stock.
Long-term storage fees: Applied to inventory sitting in Amazon warehouses over 365 days.
Inbound freight and prep costs: Often overlooked entirely in margin calculations.
Every one of these fees reduces your actual margin. An ACoS that looks efficient on the surface can translate to a net loss once you layer in all the costs Amazon does not surface in the ads console.
These hidden costs compound the problem of wasted ad spend. If you have not already, it is worth reading our breakdown of where Amazon PPC budgets go to waste to understand the full cost picture behind each campaign.
The Fix: Use a per-SKU profitability calculator that pulls all fee data together. You need the true landed profit on every unit before you set an ACoS target. Without it, you are guessing.
Returns Wreck Transactions That Looked Profitable
Amazon's returns policy creates a specific and painful problem for advertisers. When a customer clicks your ad and buys, Amazon charges you for that ad click and collects the referral fee immediately. When the customer returns the product, Amazon refunds the customer.
You are left holding the ad cost, the return shipping logistics, and sometimes a damaged or unsellable unit. That specific transaction moves deep into the red, but your ACoS dashboard already logged it as a conversion.
The Fix: Pull your return rate by ASIN regularly and factor it into your target ACoS. If 1 in 6 units comes back, your effective revenue per ad dollar is considerably lower than the dashboard suggests.
Weak Conversion Rates Turn Clicks Into Pure Cost
A strong click-through rate (CTR) with a weak conversion rate is one of the fastest ways to drain ad spend. Shoppers land on your listing, look around, and leave without buying. You pay for every one of those clicks.
When your product listing has weak images, thin bullet points, few reviews, or pricing that does not compete well, conversion rates drop. Your cost-per-click stays the same, but the revenue each click generates falls. ACoS climbs, and when it climbs enough, sellers start manually pausing campaigns, which can then pull organic ranking down with it.
Your product listing is part of your advertising infrastructure. Every element of it directly affects your cost per sale. If you want to improve conversion rates before scaling ad spend, our guide on Amazon listing optimization walks through exactly what to fix and in what order.
SellerQI's Listing Health Scanner identifies keyword gaps, image issues, indexing errors, and missing attributes across your entire catalog instantly. Some sellers have improved ranking visibility within weeks after fixing listing and indexing issues, directly lowering their effective cost per sale without touching a single bid.
The Fix: Fix your listing before you scale your budget. Conversion rate optimization comes before budget increases. More traffic to a weak listing just means more wasted spend.
How SellerQI Solves Each of These Problems
SellerQI is an AI-powered Amazon seller platform built specifically to surface the issues Amazon's own dashboards hide. If the five traps above sound familiar, here is how SellerQI addresses each one directly.
The Problem | How SellerQI Fixes It |
|---|---|
Break-even ACoS unknown | ASIN-level profit dashboard shows true margins after every fee automatically |
No visibility into TACoS | Combined ad spend + total revenue view calculates TACoS in real time without manual spreadsheets |
Hidden Amazon fees missed | Reimbursement tracker and per-unit fee breakdown surface FBA, referral, and storage costs per ASIN |
Returns destroying margins | Reimbursement recovery tracker monitors returns and refunds across shipments so nothing goes unaccounted |
Poor listing conversion rates | Listing Health Scanner identifies keyword gaps, image issues, indexing errors, and compliance problems instantly |
Stop Flying Blind on Amazon Ads SellerQI connects to your Seller Central account and gives you a complete view of profitability by ASIN, real-time TACoS tracking, listing health scores, and AI-powered recommendations. |
Frequently Asked Questions (FAQs)
What is a good ACoS on Amazon?
A good ACoS depends on your actual profit margins. Many sellers think 15–20% ACoS is profitable, but if your Amazon fees, FBA costs, and COGS are high, even a low ACoS can still lead to losses.
What is the difference between ACoS and TACoS?
ACoS measures ad spend against ad-generated sales only, while TACoS measures ad spend against your total revenue, including organic sales. TACoS gives a more accurate picture of overall profitability.
Why can Amazon returns hurt profitability so much?
When a customer returns a product, you still lose the ad spend, referral fee, and return processing costs. High return rates can quickly destroy margins even if your campaigns show a strong ACoS.
How can I improve Amazon PPC profitability?
Focus on improving product listing conversion rates, reducing unnecessary ad spend, tracking TACoS regularly, and calculating your real break-even ACoS after all Amazon fees and returns are included.